Head CT > Degenerative > Alzheimer's Disease > Imaging
Alzheimer's Disease - Imaging
![]()
Because of its low sensitivity and specificity for the diagnosis of Alzheimer's disease, imaging is typically not used to rule in Alzheimer's disease but rather to rule out other causes of dementia. Nevertheless, in the right clinical context Alzheimer's disease appears radiographically as diffuse cerebral atrophy with enlarged lateral ventricles and widened sulci on CT. On thin-section (3 mm thick) coronal T1-weighted MR, medial temporal lobe atrophy primarily in the amygdala, hippocampus, and parahippocampal gyrus may be visually evident. Utilizing MR volumetric measurements, the hippocampal formation may be quantitatively determined to show focal atrophy. In addition, the temporal horns, supracellar cisterns, and Sylvian fissures may exhibit focal symmetric or asymmetric enlargement.
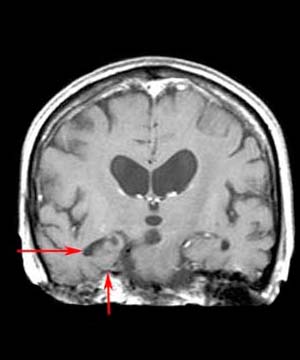 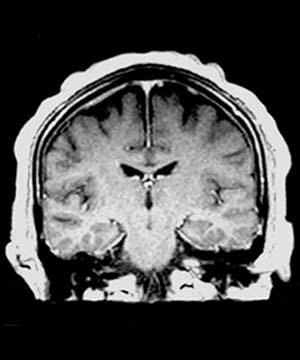 MR has been chosen for the above images because of its ability to show greater detail in Alzheimer's disease. |
|
FDG PET reveals temporoparietal metabolic deficits in patients with Alzheimer's disease. Although asymmetry is not uncommon, usually certain brain structures show metabolic sparing including the basal ganglia, thalamus, cerebellum, and primary sensorimotor cortex. Finally, on SPECT imaging bilateral temporoparietal hypoperfusion as well as decreased uptake in the medial temporal lobes and cingulated regions may be exhibited. |
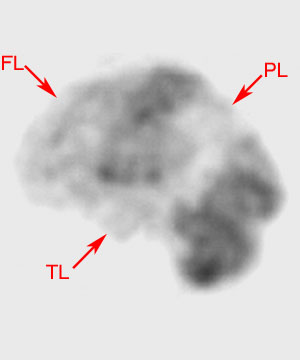 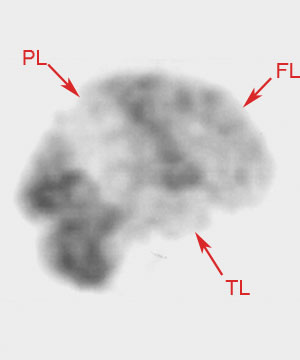 Both images above are SPECT images using Tc-99 in an individual with severe Alzheimer's disease. |
![]()
![]()