Head CT > Degenerative > Huntington's Disease > Imaging
Huntington's Disease - Imaging
![]()
Radiographically Huntington's disease characteristically exhibits caudate atrophy on imaging. This may be manifested by a decrease in the convexity of the heads of the caudate bilaterally or by an increase in the relative volume of the lateral ventricles as seen on CT or T1-weighted coronal MR. To a lesser extent putaminal atrophy may also be manifested.
One method of referencing the degree of caudate atrophy is to use the ratio between intercaudate distance and calvarial width. Known as the bicaudate ratio, the value is found by measuring the minimum distance between the caudate indentations of the frontal horns and the distance between the inner tables of the skull along the same line and multiplying that figure by 100. The Bicaudate Index (BCI) provides a standard by which configured values may be compared to age-matched controls. This parameter has been found to correlate well with caudate atrophy.
On T2-weighted MR, increased signal intensity may be found in both caudate and putamen possibly secondary to gliosis, whereas decreased signal intensity in the globus pallidus and striatum may be related to iron deposition in these structures. FDG PET may only reveal hypometabolism in the caudate nucleus.
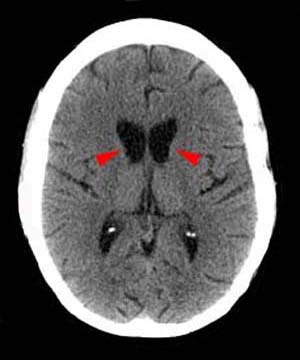 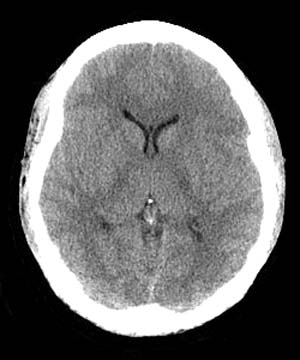 The images above are axial Head CT scans.
|
![]()
![]()