Cardiac MRI > Pathology > Valvular Disease > Valvular Disease
Valvular Disease
![]()
Abnormalities of the heart valves can be acquired or congenital. Lesions can be either regurgitant or stenotic, and the valves on the left side of the heart (mitral and aortic) are more commonly involved than the valves on the right (tricuspid and pulmonic). Stenosis typically causes hypertrophy of the myocardium in the preceding heart chamber, while regurgitant lesions typically produce dilation due to volume overload. Echocardiography, cardiac catheterization, or cardiac MRI can be used to image these abnormalities.
One of the advantages of cardiac MRI in valvular lesions is its excellent ability to quantify the degree of myocardial hypertrophy, ventricular dilation, and ventricular function - parameters which influence the timing of valve replacement surgery.
Cardiac MRI can be used to identify and quantify stenotic or regurgitant lesions. High velocity jets can be identified as signal voids on standard gradient echo cine imaging and VENC imaging can quantify the velocity and pressure gradients across a stenosis. Specialized spin echo techniques may be able to directly visualize aberrant valvular anatomy.
To determine the pressure gradient across a stenosis, the modified Bernoulli equation is employed as follows:
Where Vmax is the maximum velocity [m/s] of the jet.
This cine image in the three chamber view shows a dark flow void from a regurgitant jet going from the aorta to the left ventricle during diastole, diagnostic of aortic regurgitation.
This gradient echo cine in the two chamber long axis view shows the anterior leaflet of the mitral valve bulging into the left atrium, the characteristic finding in mitral valve prolapse (MVP). MVP can sometimes be associated with regurgitation but there is no turbulent jet seen in this case.
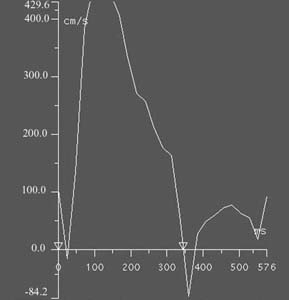
On the top is a VENC cine from a patient with aortic stenosis secondary to a bicuspid aortic valve. The VENC is oriented perpendicular to the high velocity jet, which appear black on this cine (arrow). The graph on the bottom displays peak velocity across the aortic valve versus time. The flowing blood has a maximum velocity of about 450 cm/s during systole. The normal peak velocity across the aortic valve should be less than 200 cm/s; the increased velocity in this patient is due to severe aortic stenosis.
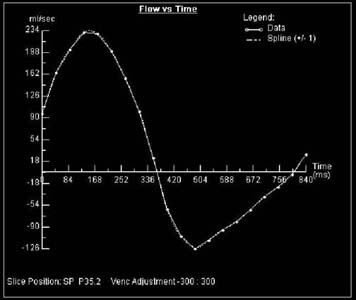
On the top is a VENC cine from a patient with pulmonary regurgitation. Flow out of the heart is white while regurgitant flow is black (arrow). The Flow vs. Time graph is on the bottom. The area under the positive part of the curve represents total forward flow while the area under the negative part of the curve represents total reverse flow.
![]()
![]()