Cardiac MRI > Post Test Answers
Posttest Answers
![]()
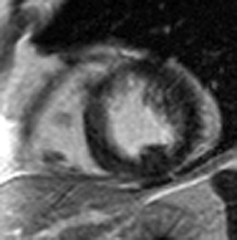
Answer: C. Aortic regurgitation and stenosis. There is both a stenotic jet which extends from the aortic valve into the ascending aorta during systole (arrow) as well as a smaller regurgitant jet extending from the aortic valve into the LV during diastole (arrowhead). Notice how there is minimal opening of the valve leaflets during systole, resulting in aortic stenosis. The right ventricle is not hypertrophied. With a ventricular septal defect, flow would be between the ventricles, which is not seen in this case. The severity of regurgitation or stenosis can be determined by the amount of signal void. Cardiac MRI has 98% sensitivity and 95% specificity for identification of aortic and mitral regurgitation. Higgins CB, Byrd BF, Stark D, et al. Diagnostic accuracy and estimation of the severity of valvular regurgitation from the signal void on cine magnetic resonance imaging. Am Heart J 1989; 118: 760-767.2) This inversion recovery sequence was taken 10 minutes after the administration of IV gadolinium. Which of the following entities does it show? 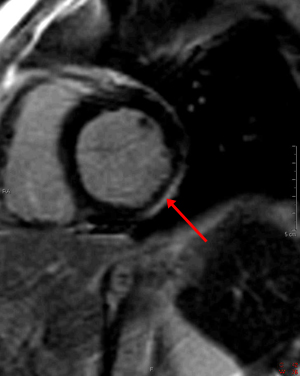 Answer: B. DHE consistent with myocarditis. The image shows DHE (arrow) along the inferolateral wall of the left ventricle epicardium. The subendocardium is normal in this region. This finding is consistent with myocarditis as opposed to myocardial infarction in which DHE always involves at least the subendocardium. The structure within the left ventricular cavity is a normal papillary muscle seen in cross-section, not a thrombus or tumor. Laissy JP, Hyarfil F, Feldman LH, et al. Differentiating acute myocardial infarction from myocarditis: diagnostic value of early- and delayed- perfusion cardiac MR imaging. Radiology 2005; 237 (1):75-82.3) This horizontal long axis SSFP demonstrates which of the following entities? Answer: A. Apical septum wall motion abnormality. This cine shows a localized abnormality of the apical septum (arrow). The myocardium in this area does not thicken as much as the surrounding myocardium. When necessary, wall thickening can be quantified to assess region wall motion abnormalities. The remainder of the left ventricle functions normally, so global systolic of diastolic function is not present. Azhari H, Sideman S, Weiss JL, et al. Three-dimensional mapping of acute ischemic regions using MRI: wall thickening versus motion analysis. Am J Physiol 1990; 259:H1492-503.4) What are the primary physiologic consequences of the entity in the image shown below? 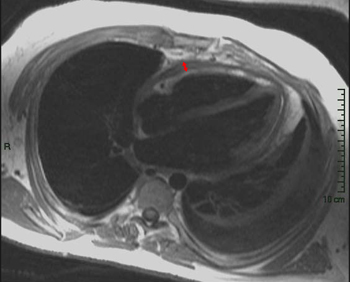 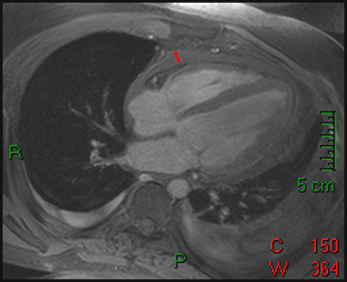 Answer: C. Restricted diastolic filling and increase in venous pressures. The figures shown above are T1-weighted and T1-weighted with fat saturation images. The images show a pericardium that is thicker than 3 mm (arrows). This finding is consistent with constricted pericarditis in the appropriate clinical setting. Axel L. Assessment of pericardial disease by magnetic resonance and computed tomography. Journal of Magnetic Resonance Imaging 2004; 19(6):816-26.5) The cine below shows findings which are characteristic of which of the following? Answer: C. Arrhythmogenic right ventricular cardiomyopathy. The above cine shows a heart with marked RV dysfunction (arrow) out of proportion to the LV. The other entities listed would be expected to affect primarily the LV. Bluemke DA, Krupinski EA, Ovitt T, et al. MR Imaging of arrhythmogenic right ventricular cardiomyopathy: morphologic findings and interobserver reliability. Cardiology 2003; 99(3): 153-62.6) The gradient echo cine below shows what congenital abnormality? Answer: A. Atrial septal defect. There is a clear defect (arrow) in the superior aspect of the interatrial septum between the right and left atria. None of the other abnormalities are seen in this image. Wang ZJ, Reddy GP, Gotway MB, Yeh BM, Higgins CB. Cardiovascular shunts: MRI imaging evaluation. Radiographics 2003;23 Spec No:S181-94.7) This spin echo image shows what aortic abnormality?  Answer: D. Aortic coarctation. This image shows an irregular narrowing at the aortic isthmus just distal to the left subclavian (arrow). MRI is especially useful in assessing the aorta after coarctation repair to assess for restenosis and the degree of collateralization utilizing VENC imaging. Kellenberger CJ, Yoo S, Valsangiacomo Buchel ER. Cardiovascular MR Imaginging in Neonates and Infants with Congenital Heart Disease. Radiographics 2007;27:5-18.8) Which of the following is shown in the IR image below acquired 10 minutes following infusion of gadolinium contrast agent? 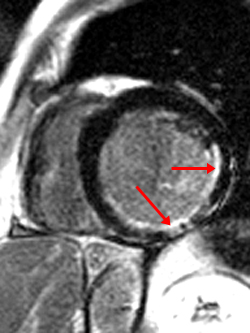 Answer: B. Subendocardial infarct. This image shows delayed hyperenhancement of the inferoseptal, inferolateral wall, and lateral LV wall. The DHE involves the subendocardium (arrow) which is suggestive of infarction, as opposed to the mid myocardial or epicardial location in myocarditis. The DHE does not involve the entire wall however, so it is a subendocardial as opposed to transmural infarct. A ventricular aneurysm would show a focal bulge of ventricular wall. Wu E, Judd RM, Vargas JD, Klocke FJ, Bonow RO, Kim RJ. Visualization of presence, location, and transmural extent of healed Q-wave and non-Q-wave myocardial infarction. Lancet 2001; 357 (9249): 21-8.9) The cine image below uses a technique specialized to determine what entity? Answer: C. Myocardial strain. This cine image uses a special modulation of magnetization to produce tag lines that move with the myocardium. The degree of deformation of the squares is used to calculate myocardial strain, which gives an accurate (sensitivity 92%, specificity 99%) quantitative assessment of myocardial function. A series of non-tagged short axis images can be used to measure ejection fraction, end-systolic volume and myocardial mass. Myocardial perfusion imaging uses gadolinium and adenosine. Gotte MJW, van Rossum AC, Twisk JWR, et al., Quantification of regional contractile function after infarction: strain analysis superior to wall thickening analysis in discriminating infarct from remote myocardium. J Am Coll Cardiol 2001; 37: 808-817.10) Which congenital cardiac anomaly is shown on the gradient echo cine below? Answer: A. Ebstein’s anomaly. In Ebstein's anomaly, the septal and posterior leaflets of the tricuspid valve (arrows) are displaced apically resulting in atrialization of the base of the right ventricle. The tricuspid annulus, however, is normally positioned between the right atrium and ventricle. The atrialized portion of the RV is thinned and prone to aneurysmal dilation. There is no connection between the two sides of the heart that would suggest a ASD or VSD. None of the findings of Tetralogy of Fallot are present. The pulmonic valve and aortic arch are not visualized in this slice. Choi YH, Park JH, Choe YH, et al. MR imaging of Ebstein’s anomaly of the triuspid valve. Am J Roentgenol 1994; 163:539-43.11) Below are pre and post gadolinium SSFP images. What abnormality do they show? 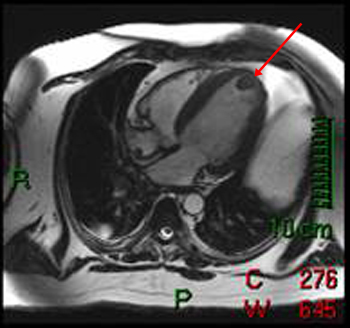 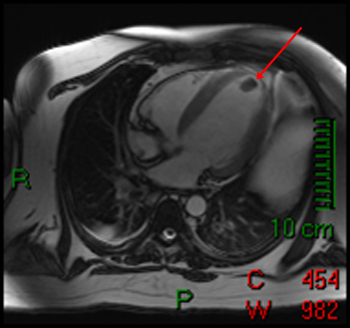 Answer: D. Thrombus. The mass in the LV does not enhnance on post-contrast imaging, which is consistent with a thrombus. Thrombi form in regions of akinesis, typically due to myocardial infarctions. Microvascular obstruction is a process which involves the myocardium. Myxomas and metastatic disease typically have a heterogenous appearance and enhance. Papillary muscles enhance with myocardium. Friedrich MG. Magnetic resonance imaging in cardiomyopathies. J Cardiovasc Magn Reson 2000;2:67-82.12) Which of the following is seen on the gradient echo cine below? Answer: B. Pericardial effusion causing cardiac tamponade. There is a large amount of fluid in the pericardial sac (arrows). This fluid is physiologically significant because the contractile function of the heart is compromised and there is diastolic collapse of multiple chambers. The fluid is within the pericardium surrounding the heart, thus excluding pericardial cyst. The pericardium is not thickened, essentially excluding constrictive pericarditis. This diagnosis is usually made with echocardiography. Bilateral pleural effusions are also present. Wang ZJ, Reddy GP, Gotway MB, Yeh BM, Hetts SW, Higgins CB. CT and MR imaging of pericardial disease. Radiographics 2003; 23: S167-80.13) What abnormality is seen in this cine? 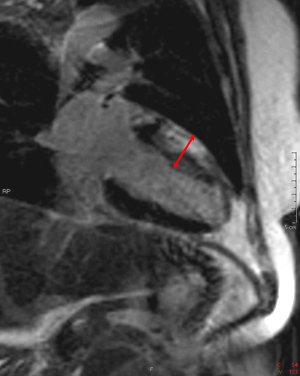 Answer: C. Delayed hyperenhancement of hypertrophic cardiomyopathy. The DHE vertical long axis image demonstrates regional hypertrophy of the myocardium in the anterior wall (arrows) which is consistent with hypertrophic cardiomyopathy. There is also subepicardial and mid-myocardial delayed enhancement in the region of the hypertrophy which is due to fibrosis. Rickers C, Willke NM, Jero-Herlold M, et al. Utility of cardiac magnetic resonance imaging in the diagnosis of hypertrophic cardiomyopathy. Circulation 2005; 112(6):855-61.14) What abnormality is seen on the SSFP vertical long axis cine seen below? Answer: A. Myxoma. This cine shows a myxoma (arrow) within the left atrium that is partially prolapsing through the mitral valve. Myxomas are most often located in the left atrium, often pedunculated, and commonly attached to the interatrial septum. When large, they can obstruct the mitral valve and cause symptoms of mitral stenosis. Myxomas are well encapsulated unlike angiosarcomas which are a malignant tumor and are very invasive. A lipoma should have the same signal as subcutaneous fat, therefore it would be much brighter than this mass. This would be an unusual location for an intracardial thrombus, which typically form in areas of minimal motion. Sparrow PJ, Kurian JB, Jones TR, Sivananthan MU. MR Imaging of cardiac tumors. Radiographics 2005; 25(5): 1255-76.15) Below are perfusion images of basal, mid, and apical slices along with a delayed hyperenhancement image (bottom) aligned with the mid slice. The resting images are displayed on the top left with the Adenosine images displayed in the top right. What abnormality is seen in these images?
Answer: D. Ischemia of inferior wall. The rest perfusion images show no abnormalities, but there is a clear lack of perfusion in the inferior wall (arrow) on the stress images on all slices. There is no delayed enhancement on the mid slice. This constellation of findings is consistent with ischemia. Artifact would appear as a perfusion defect on both stress and rest images, but would have no delayed enhancement. An infarct would appear as delayed enhancment. Crean A, Merchant A. MR perfusion and delayed enhancement imaging in the heart. Clinical Radiology 2006; 61(3): 225-236.16) What aortic abnormality is seen on this T1 weighted axial image below? 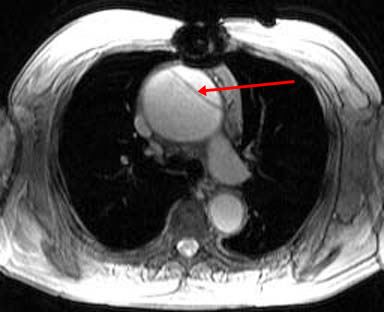
Answer: D. Stanford Type A Aortic Dissection. This image shows a dilation of the ascending aorta with a normal caliber descending aorta. An intimal flap can clearly be seen in the ascending aorta (arrow) representing an aortic dissection. There is no wall thicken to suggest an intramural hematoma. This aortic dissection is Stanford Type A since it includes the ascending aorta; Type B would include only the descending aorta. Somner T, Freshke W, Holzknecht N et al. Aortic dissection: a comparitive study of diagnosis with spiral CT, multiplanar transesophageal echocardiography, and MR imaging. Radiology 1996; 199(2): 347-52.17) What abnormality is seen on the T1-weighted (left) and T2-weighted (right) images below? 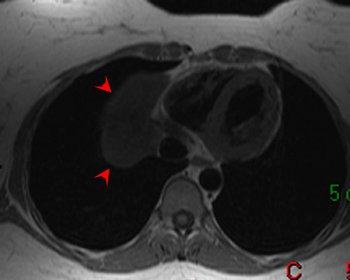  Answer: A. Pericardial Cyst. These images show a homogenous mass (arrowheads) in the right cardiophrenic angle that is adherent to the pericardium and has relatively high signal on T2-weighted images and relatively low signal on T1-weighted images. The signal characteristics and cardiophrenic location are classic for a pericardial cyst. A lipoma would have signal characteristics that mirror subcuanteous fat. A myxoma would be within the heart itself. A pericardial mesothelioma would be more heterogenous. Constrictive pericarditis normally appears as a thickening of the pericardium, but these images clearly show a mass. Breen, JF. Imaging of the Pericardium. Journal of Thoracic Imaging 2001; 16(1): 47-54.18) This image is most consistent with what diagnosis?  Answer: C. Amyloidosis. This image shows DHE sparing the subendocardium in a somewhat patchy distribution (arrows); this is most consistent with amyloidosis. There is no pericardial thickening to suggest constrictive pericarditis. Transmural and subendocardial infarctions would have DHE in a coronary artery distribution. VSD would demonstrate a connection between the ventricles. Maceira AM, Fisher NG, McKenna WJ, Pennell DK, et al. Cardiovascular magnetic resonance in cardiac amyloidosis. Circulation 2005; 111(2): 186-93.19) What abnormality is seen in the sagital view below? 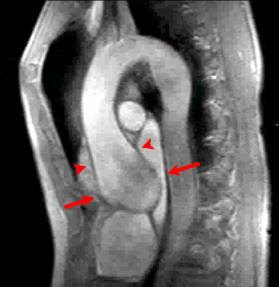 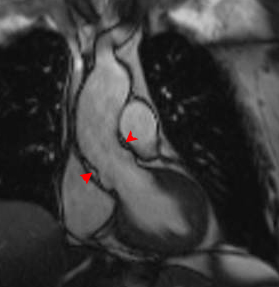 Answer: C. Aneurysm of the aortic root. This image shows a fusiform aneurysm of the aortic root (arrows) in a patient with Marfan�s syndrome. Additionally, there is loss of the distinctness of the sinotubular junction (arrowheads), a common finding in patients with Marfan's syndrome. Compare with the normal aorta in the image to the right (coronal image). These patients need periodic examinations to determine the necessity of prophylactic surgery to prevent aortic dissection. There is no intimal flap seen, so the patient has not yet suffered a dissection. Fattori R, Bacchi Reggiani L, Pepe G, Napoli G, Bna C, Celletti F, Lovato L, Gavelli G. Magnetic resonance imaging evaluation of aortic elastic properties as early expression of Marfan syndrome. Journal of Cardiovascular Magnetic Resonance 2000; 2(4): 251-6.20) What abnormality is seen in the DHE image below? 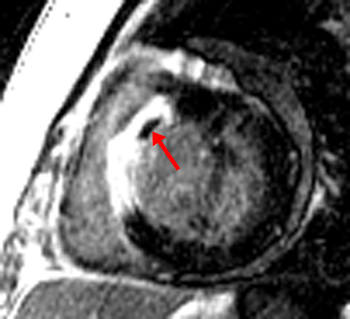 Answer: C. Microvascular obstruction. There is a focus of unenhanced subendocardium (arrow) surrounded by transmural DHE in the anteroseptum. This unenhanced subendocardium represents an area of microvascular obstruction (MO) within a transmural infarction. Gadolinium contrast media cannot enter an area of MO because the vessels are destroyed. Wu KC, Kim RJ, Bluemke DA, et al. Quantification and time course of microvascular obstruction by contrast-enhanced echocardiography and magnetic resonance imaging following acute myocardial infarction and reperfusion. Journal of American College of Cardiology 1998; 32:1756-1764. |
![]()
![]()