Cardiac MRI > Technique > ECG Gating
ECG Gating
![]()
The fundamental challenges of cardiac MRI imaging is that movement of the heart throughout the cardiac cycle and the movement of the lungs during the respiratory cycle produce motion artifacts in the image. Respiratory motion can be alleviated with breath holding during imaging. The problem of heart motion can be solved with the use of ECG gated imaging. ECG gating allows for stop motion imaging by acquiring data only during a specified portion of the cardiac cycle, typically during diastole when the heart is not moving. The R wave of the ECG is used as a reference point with data acquisition being initiated following a given delay after the R wave. Images are created from data collected over a series of cardiac cycles (R to R intervals).
ECG leads are placed over the patient�s left chest using either a three or four lead configuration. Lead are positioned such to accentuate the R wave and minimized the T wave. Patients with a prominent T wave often prove difficult to image as misgating can occur from triggering off the T wave rather than the R wave. Artifacts also occur when there are differences in the length of the R to R interval, such as occurs in cardiac dysrhythmias. EGC gating may be impaired in people with a low ECG signal. A low ECG signal results from geometries that decrease signal to the ECG leads, such as in barrel chested patients with COPD. Large pericardial effusion can also decrease the ECG signal. A common gating artifact, known as the magnetohydrodynamic effect, occurs when ions within the blood are transported through a magnetic field, inducing a voltage and distorting the ECG recording. This artifact can be often be overcome by vectorcardiogram gating (VCG), which can distinguish electrical activity of the heart from ions in the blood. In cases where ECG gating is unsuccessful, pulse triggering can be employed using a pulse oximeter with the systolic upstroke as the trigger for the pulse sequence. This technique is not very successful in patients with a delayed pulse upstroke relative to heart contraction.
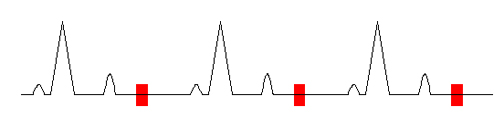
This figure shows an ECG tracing with the red boxes representing the acquisition periods. Information is acquired at the same point in each cardiac cycle across multiple cycles to make the final image.
![]()
![]()