Emergency Ultrasound > Technique > Terms-Doppler
Technique - Terms-Doppler
![]()
The Doppler shift is the difference in sound frequency between the US beam transmitted into tissue and the echo produced by reflection from the moving red blood cells (RBCs). The Doppler beam intercepts moving blood within a blood vessel at an angle called the Doppler angle. If an object moves away from the ultrasound transducer, the wavelength increases and frequency decreases based on velocity (v) = frequency (f) x wavelength (l). If the object moves toward the transducer, the wavelength decreases and the frequency increases. The amount of frequency shift is proportional to the velocity of the moving RBCs. By using the Doppler equation and the computer intrinsic to the US units, the Doppler shift can be measured.
Doppler Equation =(2 x f x v x cosine of Doppler angle)/C
f = transducer frequency (MHZ), v = velocity of RBCs, C = constant (velocity of sound in soft tissue)
A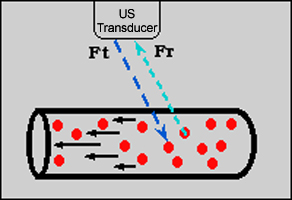 B
B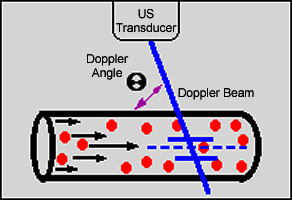
A. Drawing illustrates the Doppler frequency shift. Ft is the frequency of the transmitted Doppler beam and Fr is the frequency of the Doppler echo returned to the transducer. B. Drawing illustrates the Doppler beam and Doppler angle used to communicate to the US computer the estimated direction of blood flow.
The Doppler equation demonstrates that the maximum frequency shift will be obtained by directing the Doppler interrogation beam at a Doppler angle of 0 degrees since cosine of 0 degrees is 1. However, most blood vessels course parallel to the skin and zero Doppler angle is seldom obtainable. In addition, no Doppler shift is obtained at 90 degrees since cosine of 90 degrees is 0. Thus, the optimal Doppler angle lies between 45 and 60 degrees.
There are three types of Doppler displays. In the Doppler spectral display, velocity is plotted on the vertical scale (y axis) and time is plotted on the horizontal scale (x axis). The directions towards the transducer is above the baseline and the direction away from the transducer is below the baseline. Spectral waveforms vary over time with cardiac contraction with highest flow velocities during systole and lowest flow velocities during diastole.
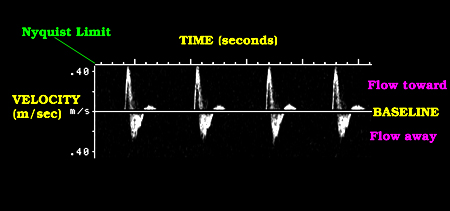
Image demonstrating Doppler spectral display.
In the color Dopplerdisplay, velocity and direction are color-coded. Color Doppler imaging superimposes Doppler flow information on a standard gray-scale real-time US image. The color map is divided into two parts by a black bar that corresponds to zero flow point on the Doppler spectral display. The color above the black bar is used to show flow relatively toward the Doppler beam and the color below the black bar is used to show flow relatively away from the Doppler beam. The brighter colors correspond to higher mean velocities and the darker colors indicate lower mean velocities.
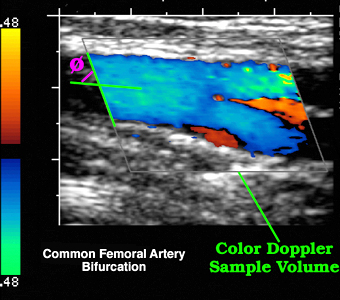
Image demonstrating color Doppler display.
In the duplex Doppler display, gray scale is simultaneously combined with spectral Doppler.
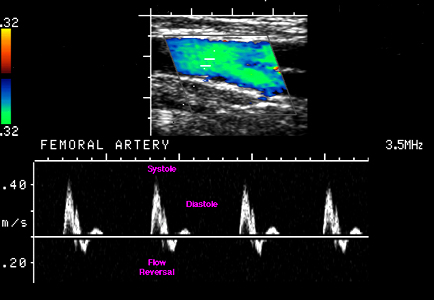
Image demonstrating duplex Doppler display.
![]()
![]()